All published articles of this journal are available on ScienceDirect.
Morphometric Measurements, Meristic Counts, and Molecular Identification of Alestes Dentex, Alestes Baremoze, Brycinus Nurse, and Brycinus macrolepidotus from the River Nile at Kreima
Abstract
Introduction:
Twenty-two morphometric characters and seven meristic counts were recorded from 324 Alestes specimens from Kreima at the River Nile.
Materials and Methods:
Specimens collected were identified to the species level as Alestes baremoze (100 specimens), Brycinus nurse (100 specimens), Brycinus macrolepidotus (24 specimens), and Alestes dentex (100 specimens). The principal component analysis showed that the lateral line scales and the scale above the lateral line contributed to the percentage variance by 97.01% and 2.56%, respectively. Discriminant function analysis was done to discriminate between field-collected samples of Alestes sp. The LLS, AFR, and LDFL (Longest of Dorsal Fin Lings) were found to be the main characters that discriminate between the four populations.
Results and Discussion:
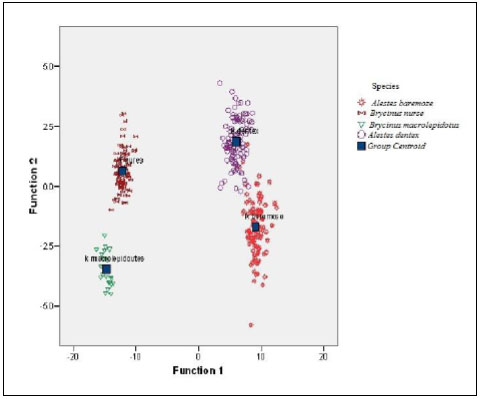
The first function showed that they were significantly different. This discrimination was a complete one since 98.1% of original grouped specimens and 97.8% of the cross-validated ones were correctly classified. The scatter plot of Discriminant scores from the three functions showed some relatedness between Alestes baremoze and Alestes dentex.
16S ribosomal RNA primers have been used to identify the species at the molecular level. All species have shown a characteristic band (680 bp) indicating successful amplification. Five RAPD primers have been used to investigate the Alestes species. Similar and dissimilar DNA bands indicate the evolutionary connections and genetic spacing, respectively. The derived dendrograms based on morphometric measurements and meristic counts were closer to that derived from the RAPD PCR results.
Conclusion:
The study showed co-existence of four Alestes species in the main River Nile.
1. INTRODUCTION
Fishes live almost in all kinds of water ranging from Antarctic waters below freezing to hot springs of more than 40ºC in Sahara and perform all their vital functions [1].
The Nilotic fauna is rich and diverse in fish species, with over 300 species falling at least into 54 genera [2]. This diversity is related to the diversification of the habitat of the Nile system itself (natural and man-made lakes, falls, cataracts, swamps, canalization systems, etc). In some instances, the deliberate introduction of exogenous species into parts of the Nile system or canalization system contributes to the diversity of fish species [3].
The first systematic account of the freshwater fishes of Sudan was given by Boulenger [4]. Since then, few additions were made. These included Synodntis khartoumiensis, reported by Abu-Gideiri [5] and Labeo meroensis, given by Moritz [6].
The Characiformes, one of the major lineages of ostariophysan fishes, is widely distributed through freshwaters of major portions of the Americas and Africa [7]. Phylogenetic studies in African Characiformes described a clade consisting of the families Distichodontidae and Citharinidae [8]; a clade formed by the monotypic family Hepsetidae; and the Alestidae [7].
The RAPD technique samples the genome in a highly randomized way [9]. In fishes, this technique has been successfully used to supplement systematic and Phylogenetic studies of natural populations, including species and subspecies [10-12].
In his guide to the fishes of the River Nile in the Republic of Sudan [13], Bailey divided the genus Alestes into two genera Alestes to include (A. baremoze and A. dentex) and Brycinus to include Brycinus (Alestes) nurse and Brycinus (Alestes) macrolepidotus.
The objectives of this study are to revise the systematic status of Alestes spp.in Sudan based on samples collected from Kreima site, to verify whether the splitting of the genus Alestes into Alestes and Brycinus genera is correct or not. The approach was based on molecular analyses, morphometric measurements, and meristic counts.
2. MATERIALS AND METHODS
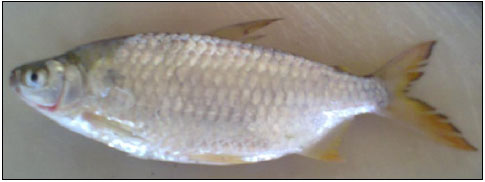
Fish samples were randomly collected from the River Nile around Kreima by gill nets of mesh size of 2x2 and 3x3 cm or were purchased from the operating fisher (Plate 1-4). Morphometric measuremens and meristic counts for each sample were recorded (Table 1). Morphological identification is as follows [13-16].



| Character and (Abbreviations) | Description and (Measuring device) ٭ |
|---|---|
| Total Length, (TL) | Distance from the tip of snout to the posterior tip of the lower lobe of the caudal fin, (MB) |
| Standard Length, (SL) | Distance from the tip of the snout to the caudal- fin base at articulation, (MB) |
| Head Length, (HL) | Distance from the tip of the snout to bony posterior margin of the operculum, (V) |
| Head Width, (HW) | Head width measured at the level of the posterior edge of fontanel, (V) |
| Snout Length, (SNL) | Distance from the tip of the snout to bony anterior margin of eye, (V) |
| Eye Diameter, (ED) | Distance between the anterior and posterior border of eye, (V) |
| Inter Orbital distance, (IOD) | The Minimal distance between orbits, (V). |
| Body Depth, (BD) | Maximal vertical body depth situated in- between the anterior base of dorsal fin and origin of the pelvic fin, (T). |
| Body Width, (BW) | The greatest width just posterior to the gill opening, (V) |
| Pre-pectoral Length, (PPCL) | Distance from the tip of snout to the base of first pectoral-fin ray, (T). |
| Pre-pelvic Length, (PPVL) | Distance from the tip of snout to the base of first pelvic-fin ray, (T) |
| Pre-anal Length, (PAL) | Distance from the tip of snout to the base of first anal-fin ray, (T). |
| Pre-dorsal Length, (PDL) | Distance from the tip of snout to the base of first dorsal-fin ray, (T) |
|
Longest Dorsal-fin ray Length, (LDFL) |
Distance between the most anterior and posterior point of dorsal-fin base, (V) |
| Dorsal-fin Base Length, (DFBL) | Distance between the most anterior and posterior point of dorsal-fin base, (V) |
| Dorsal-adipose Distance, (DAD) | Distance between the most posterior point of dorsal-fin base and anterior point of dorsal-fin base and anterior point of the adipose-fin base, (V). |
| Caudal-peduncle Length, (CPL) | The horizontal distance between the most posterior point of the caudal fin at articulation, (V) |
| Caudal-peduncle Depth, (CPD) | Minimum vertical depth of caudal peduncle, (V). |
|
Anal-fin Base Length, (AFBL) |
Distance between the most anterior and posterior point of anal-fin base, (V) |
| Pelvic fin Length, (PVFL) | From base to the tip of the pelvic fin, (V) |
| Pectoral fin Length, (PFL) | From base to the tip of the pectoral fin, (V) |
| Caudal fin Length, (CFL) | From tail base to the tip of the caudal fin, (V) |
| S. No. | Character | Description | Acronym |
|---|---|---|---|
| 1 | Dorsal fin ray | Number of the dorsal fin rays | DFR |
| 2 | Anal fin ray | Number of anal rays | AFR |
| 3 | Pectoral Fin Ray | Number of the pectoral Fin rays | PFR |
| 4 | Pelvic fin ray | Number of the pelvic Fin rays | PVFR |
| 5 | Lateral line scale | Number of scales along the lateral line | LLS |
| 6 | Scales above lateral line | Number of scales between the anterior origin of dorsal-fin base and lateral line | SALL |
| 7 | Scales below lateral line | Number of scales in an anterior-posterior line between lateral line and ventral midline | SBLL |
2.1. Morphometric Measurements:
Morphometric measurements for each sample are recorded in Table 1. Morphological identification followed studies by Bailey, Sandon, Abu Gideiri, and Paugy [13-16].
2.2. Meristic Counts
Meristic counts for each sample (Table 2) followed studies by Paugy, Barel, Sneoks, and Ebraheem [16-19].
2.3. Identification of Alestes and Brycinus species using molecular techniques:
Molecular identification of species was made by taking about 3×2cm of the dorsal fins from each fish sample and preserving it in 70% ethanol at -20°C. Then DNA extraction and detection were performed using potassium acetate method [20] with some modification. Identification of Alestes spp. was made using Mitochondrial (rRNA gene) 16s typing 16S ar (ACG CCT GTT TAT CAA AAA CAT) and 16S br (CCG GTC TGA ACT CAG ATC ACG T) [21]. RAPD profile analyses were evaluated for 23 samples [22]. Sequences of the RAPD primers used are tabulated in Table 3.
2.4. Data Analysis
Morphometric measurements, meristic counts and ratios indices were performed using one-way ANOVA, the principal component analysis and discriminate analysis in SPSS Version 15. Analyses of RAPD genotyping were made by recording the presence and absence of each band and one-way ANOVA for Discriminate Function Analysis (DFA). Dendrogram of neighbour joining tree, the GenAlEx (Version 6.5) software [23], was used for Shannon analyses to investigate the variation from Alestes spp. Genetic relatedness among species and populations were tested by NJ tree and accordingly dendrogram was constructed using PAUP (Version 4.0b10-Microsoft windows) program.
| Original Name |
Current Symbol |
Seq. (5ʹ to 3ʹ) |
|---|---|---|
| OPW-05 | RAPD 1 | GGC GGA TAA G |
| OPW-08 | RAPD 2 | GAC TGC CTC T |
| OPW-09 | RAPD 3 | GTG ACC GAG T |
| OPX-17 | RAPD 4 | GAC ACG GAC C |
| OPX-19 | RAPD 5 | TGG CAA GGC A |
| Ratio | A. baremoze | A. dentex | B. nurse | B. macrolepidotus | P- value |
|---|---|---|---|---|---|
| Mean±SE | Mean±SE | Mean±SE | Mean ±SE | 0.000 | |
| HW/HL | 0.451±0.002 | 0.474±0.003 | 0.545±0.004 | 0.529±0.002 | 0.000 |
| SNL/HL | 0.290±0.001 | 0.308±0.002 | 0.317±0.004 | 0.348±0.006 | 0.000 |
| ED/HL | 0.303±0.001 | 0.311±0.001 | 0.339±0.002 | 0.287±0.006 | 0.000 |
| IOD/HL | 0.329±0.001 | 0.355±0.002 | 0.391±0.005 | 0.483±0.004 | 0.000 |
| HL/SL | 0.178±0.001 | 0.185±0.005 | 0.218±0.001 | 0.221±0.001 | 0.000 |
| BD/SL | 0.223±0.002 | 0.233±0.001 | 0.291±0.002 | 0.236±0.003 | 0.000 |
| BW/SL | 0.092±0.000 | 0.100±0.000 | 0.132±0.001 | 0.130±0.001 | 0.000 |
| PPCL/SL | 0.192±0.001 | 0.195±0.001 | 0.229±0.001 | 0.221±0.001 | 0.000 |
| PPVL/SL | 0.441±0.003 | 0.457±0.001 | 0.491±0.002 | 0.497±0.002 | 0.000 |
| PAL/SL | 0.644±0.004 | 0.673±0.001 | 0.758±0.007 | 0.771±0.006 | 0.000 |
| PDL/SL | 0.488±0.003 | 0.484±0.001 | 0.487±0.002 | 0.577±0.003 | 0.000 |
| LDFL/SL | 0.180±0.001 | 0.194±0.000 | 0.227±0.001 | 0.198±0.002 | 0.000 |
| DFBL/SL | 0.089±0.000 | 0.094±0.000 | 0.108±0.000 | 0.094±0.000 | 0.000 |
| DAD/SL | 0.260±0.002 | 0.262±0.001 | 0.259±0.002 | 0.186±0.002 | 0.000 |
| CPL/SL | 0.159±0.001 | 0.161±0.000 | 0.153±0.002 | 0.141±0.001 | 0.000 |
| CPD/SL | 0.076±0.000 | 0.082±0.000 | 0.093±0.001 | 0.093±0.000 | 0.000 |
| AFBL/SL | 0.220±0.001 | 0.193±0.000 | 0.139±0.000 | 0.141±0.001 | 0.000 |
| PVFL/SL | 0.128±0.000 | 0.132±0.000 | 0.167±0.001 | 0.170±0.001 | 0.000 |
| PFL/SL | 0.155±0.001 | 0.149±0.000 | 0.181±0.001 | 0.204±0.001 | 0.000 |
| CFL/SL | 0.293±0.001 | 0.299±0.001 | 0.272±0.001 | 0.232±0.004 | 0.000 |
3. RESULTS
3.1. Morphometric Measurements
A total of 324 Alestes specimens were identified morphologically and quantified statistically. A highly statistically significant difference (p=0.000) between all the studied populations (Table 4) was detected by one way ANOVA.
3.2. Meristic Counts
The K independent sample test showed highly statistically significant differences (p<0.000) in AFR, LLS, and SAL; statistically significant differences (p<0.05) in DFR and PFR; and insignificant differences (p<0.05) in PVFR and BELL) (Table 5).
3.3. Principal Component Analysis
PCA (Table 6) showed one component with Eigenvalue more than 1 explaining the data with component percentage variance of 97.01%. The component was mostly influenced by the variables measured.
Plotting the Eigenvalues by their respective component number (See plot, Fig. 1) showed that the total of component 1 is 110.47 with 97.01% variance, indicating a sharp decrease from component 1to component 27 with a total variable of 3.00E_005 and 2.63E_005% variance. PCA selected and ranked 11 characters as reliable descriptive of the four species. This included 3 meristic counts out of 7 (LLS, SALL, and AFR) and 8 morphometric measurements (Table 6). The rescaled 27 variables showed 6 meristic counts and 4 morphometric characters with negative coefficients (Table 6). The negative coefficients indicate that there was a negative correlation between the original variables and the component scores.
Box and whisker plots (Fig. 2) showed highly significant variations between the different Alestes species populations (p=0.000).
| Meristic | A. baremoze | A.dentex | B. nurse | B. macrolepidotus | P- value | ||||
| Median | Range | Median | Range | Median | Range | Median | Range | ||
| DFR | 11 | 11 | 11 | 10-12 | 11 | 11-12 | 10 | 10-11 | 0.010 |
| AFR | 27 | 22-30 | 23 | 20-26 | 16 | 15-18 | 16 | 15-18 | 0.000 |
| PFR | 13 | 13-15 | 13 | 13-15 | 13 | 12-15 | 14 | 12-15 | 0.013 |
| PVFR | 9 | 9 | 9 | 9 | 9 | 9-10 | 9 | 9 | 0.520 |
| LLS | 47 | 44-51 | 46 | 42-50 | 29 | 27-32 | 24 | 23-23 | 0.000 |
| SALL | 8.5 | 8.5-9,5 | 8.5 | 7.5-9.5 | 5.5 | 5.5-6.5 | 4.5 | 4.5 | 0.000 |
| SBLL | 3.5 | 3.5 | 3.5 | 3.5 | 3.5 | 2.5-3.5 | 3.5 | 3.5 | 0.213 |
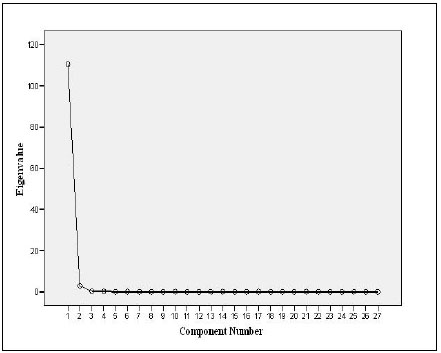
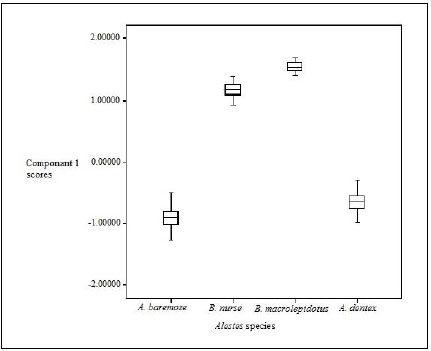
Table 6 Principal component analysis (Contribution of 27 variables to the first principal components calculated from 324 specimens of Alestes spp. from Kreima site) Relative percentage variance for component 1 was 97.01%.
Box-plot based on scores of principal component 1(Table 6) showed that the scores of characters were in the order B. macrolepidotus>B .nurse > A. dentex > A. baremoze (Fig. 2).
3.4. Cluster Analysis
For better understanding of the differentiation of the stu dy species from Kreima sites, hierarchical cluster analysis of the morphometric measurements and meristic counts, morpho metric measurements, meristic counts and of LLS- SALL- AFR- AFBL/SL (Figs. 3-7), respectively were performed to investigate the relationships among the different populations of Alestes spp. from Kreima sites.
Cluster analysis showed that A. baremoze and A. dentex form one cluster whereas, A. nurse and A. macrolepidotus form another cluster (Figs. 3-6).
3.5. Discriminant Function Analysis
Canonical discriminant analysis was applied on the morphometrics and meristics data of Alestes spp. from Kreima. The analysis was applied to 11 most important characters for component 1, derived by the PCA (Table 6). The characters were used in bold type (Table 6). When these characters were subjected to discriminant function analysis, three significant functions were derived with 96.7%, 2.9%, and 0.4% and explained by factor 1, factor 2, and factor 3, respectively. The three functions had a p-value (p=0.000) indicates that the group centroids of the four species were highly significantly different. The canonical correlation coefficient of functions 1, 2, and 3 was 0.995, 0.866, and 0.523 in Eigenvalues 99.066, 3.007, and 0.377, respectively, and the related Chi-square=1966.685, 531.969 and 99.590, this indicates a low correlation between the discriminant functions and the original variables. The Chi-square was highly significant (p=0.000; df=33, 20, and 9) in the three functions, respectively, indicating population with definite differences between the four species.
The discriminant functions were calculated from the 11 selected variables and the largest absolute correlation between each variable and any discriminant function are indicated by a (*) in Table 7. The variables that most influenced the separation of the three species were: LLS, SALL, BW, PVFL, and HL in function 1, AFR, AFBL, and PFL in function 2, and LDFL, PPCL, and HW in function 3 (Table 7). While the result showed that function 1 and function 2 depend on the morphometric and meristic characters, function 3 depends only on morphometric characters.
| No. | Character | Component 1 | No. | Character | Component 1 |
| 1 | LLS | -0.997 | 15 | CPD2 | 0.625 |
| 2 | SALL | -0.965 | 16 | PPVL2 | 0.625 |
| 3 | AFR | -0.951 | 17 | CFL2 | -0.597 |
| 4 | AFBL2 | -0.934 | 18 | DFBL2 | 0.591 |
| 5 | PVFL2 | 0.860 | 19 | SNL2 | 0.401 |
| 6 | BW2 | 0.846 | 20 | ED2 | 0.371 |
| 7 | HL2 | 0.828 | 21 | DAD2 | -0.365 |
| 8 | PFL2 | 0.783 | 22 | CPL2 | -0.294 |
| 9 | PPCL2 | 0.771 | 23 | PDL2 | 0.289 |
| 10 | LDFL2 | 0.745 | 24 | SBLL | -0.093 |
| 11 | HW2 | 0.719 | 25 | PFR | -0.076 |
| 12 | PAL2 | 0.693 | 26 | PVR | 0.057 |
| 13 | BD2 | 0.680 | 27 | DFR | -0.056 |
| 14 | IOD2 | 0.662 |


This discrimination was a complete one since 98.1% of original grouped specimens and 97.8% of cross-validated ones were correctly classified (Table 8).
The scatter plot of the canonical discriminant functions derived from measured characters of four Alestes species collected from Kreima site (Fig. 7) showed differentiation between the four species and there were a few relationships between A.baremoze and A.dentex.

| Character | CDF | SCDF | Loading | ||||||
| Function | Function | Function | |||||||
| 1 | 2 | 3 | 1 | 2 | 3 | 1 | 2 | 3 | |
| LLS | 0.413 | 0.238 | -0.086 | 0.605 | 0.348 | -0.126 | 0.625* | 0.355 | -0.035 |
| SALL | 1.217 | 1.092 | -0.484 | 0.440 | 0.395 | -0.175 | 0.460* | 0.453 | -0.136 |
| BW/SL | -39.338 | -3.045 | 19.001 | -0.376 | -0.029 | 0.182 | -0.185* | 0.123 | 0.118 |
| PVFL/SL | -6.871 | -4.564 | -18.591 | -0.071 | -0.047 | -0.191 | -0.177* | -0.019 | 0.132 |
| HL/SL | -18.597 | 5.003 | -55.110 | -0.217 | 0.058 | -0.644 | -0.155* | 0.040 | -0.024 |
| AFR | 0.367 | -0.554 | 0.345 | 0.357 | -0.540 | 0.337 | 0.489 | -0.614* | 0.378 |
| AFBL/SL | 26.865 | -27.349 | 17.084 | 0.260 | -0.264 | 0.165 | 0.349 | -0.414* | 0.269 |
| PFL/SL | -4.161 | -24.364 | -16.218 | -0.049 | -0.285 | -0.190 | -0.138 | -0.306* | -0.200 |
| LDFL/SL | -6.748 | 31.715 | 73.997 | -0.075 | 0.352 | 0.822 | -0.153 | 0.401 | 0.668* |
| PPCL/SL | -3.063 | 6.364 | 47.580 | -0.038 | 0.079 | 0.592 | -0.131 | 0.045 | 0.371* |
| HW/SL | -3.940 | 5.742 | -3.577 | -0.139 | 0.202 | -0.126 | -0.113 | 0.121 | 0.148* |
| Original | Species | Predicted Group Membership | Total | ||||
| A.baremoze | A.dentex | B. nurse | B. macrolepidotus | ||||
| A.baremoze | Count | 95 | 5 | 0 | 0 | 100 | |
| % | 95 | 5 | 0 | 0 | 100 | ||
| A.dentex | Cont | 1 | 99 | 0 | 0 | 100 | |
| % | 1 | 99 | 0 | 0 | 100 | ||
| B. nurse | Count | 0 | 0 | 0 | 23 | 23 | |
| % | 0 | 0 | 100 | 0 | 100 | ||
| B. macrolepidotus | Cont | 0 | 0 | 0 | 24 | 24 | |
| % | 0 | 0 | 0 | 100 | 100 | ||
| Cross-validated | A.baremoze | Count | 95 | 5 | 0 | 0 | 100 |
| % | 95 | 5 | 0 | 0 | 100 | ||
| A.dentex | Count | 1 | 99 | 0 | 0 | 100 | |
| % | 1 | 99 | 0 | 0 | 100 | ||
| B.nurse | Count | 0 | 0 | 96 | 1 | 97 | |
| % | 0 | 0 | 99 | 1 | 100 | ||
| B. macrolepidotus | Count | 0 | 0 | 0 | 23 | 23 | |
| % | 0 | 0 | 0 | 100 | 100 | ||
| Primers | Locus | ||||||||||||||
| 1 | 2 | 3 | 4 | 5 | 6 | 7 | 8 | 9 | 10 | 11 | 12 | 13 | 14 | 15 | |
| Bands (~ bp) | |||||||||||||||
| RAPD1 | 200 | 300 | 400 | 450 | 500 | 550 | 600 | 650 | 750 | 800 | - | - | - | - | - |
| RAPD2 | 300 | 400 | 450 | 500 | 600 | 700 | 800 | 900 | 1100 | 1200 | - | - | - | - | - |
| RAPD3 | 300 | 400 | 450 | 500 | 550 | 650 | 700 | 750 | 800 | 850 | 900 | 950 | 1000 | 1200 | |
| RAPD4 | 300 | 350 | 400 | 450 | 500 | 550 | 600 | 650 | 700 | 750 | 800 | 850 | 900 | 1200 | 1400 |
| RAPD5 | 300 | 350 | 400 | 500 | 550 | 600 | 650 | 750 | 800 | 900 | 950 | ||||
3.6. Identification of Alestes Species using Mitochondrial (r RNA gene) 16s Typing
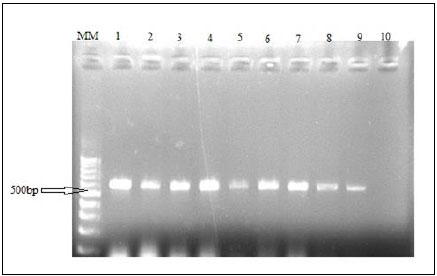
An mtDNA diagnostic fragment of approximately 680 bp was obtained by PCR from the324 specimens of Alestes spp. from Kreima sites (Fig. 8).
3.7. Detection of Genetic Variability using RAPD Markers
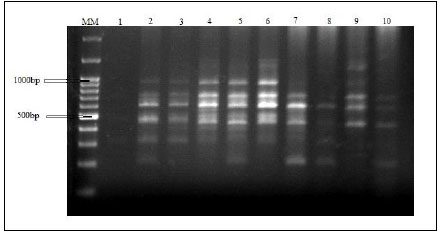
Amplified DNA fragments by five selected primers have produced a total of 60 polymorphic bands ranging from 200 to 1400bp. RAPD electrophoresis profiles are represented in Fig. (9). The bands/primer were 10 to 15. The band size for RAPD1 ranged from 200 bp to 800 bp, those for both RAPD2 and RAPD3 ranged from 300 bp to 1200 bp. The band size for RAPD4 ranged from 300bp to 1400bp and for RAPD5 ranged from 300 to 950bp (Table 9). The five RAPD primers showed polymorphic bands with percentages of 60%, 50%, 57.14%, 66.67%, and 63.64%, respectively, as represented in Table 10.
3.8. Detection Variation between Populations as Indicated by Shannon Information
The Shannon Information analyzed from RAPD3 banding pattern showed a degree of variation of 98% at a 300bp locus within populations. A 100% variation was obtained with RAPD4 at 600bp locus among populations. The Estimated Probability (EP) in Shannon analysis of RAPD1 showed insignificant variation between A. baremoze and A.dentex also between A. nurse and A. dentex. RAPD2 showed insignificant variation between A.baremoze and A.dentex. RAPD3 showed insignificant variation between A. baremoze and A. nurse and between A. baremoze and A. dentex. RAPD4 and RAPD5 showed extremely highly significant variation between the four species of Alestes.
| Primer | Total Bands | Monomorphic Bands | % | Polymorphic Bands | % |
|---|---|---|---|---|---|
| RAPD1 | 10 | 4 | 40 | 6 | 60 |
| RAPD2 | 10 | 5 | 50 | 5 | 50 |
| RAPD3 | 14 | 6 | 42.86 | 8 | 57.14 |
| RAPD4 | 15 | 5 | 33.33 | 10 | 66.67 |
| RAPD5 | 11 | 4 | 36.36 | 7 | 63.64 |
| Primer | Among Population | Within Population |
|---|---|---|
| RAPD1 | 5.6 - 24 | 10.8 - 43.6 |
| RAPD2 | 5.7 - 43.1 | 10.0 - 54.4 |
| RAPD3 | 1.3 - 41.4 | 10.0 - 60.3 |
| RAPD4 | 5.0 - 48.1 | 0.0 - 26.9 |
| RAPD5 | 5.0 - 53.7 | 11.5 - 36.8 |

*The number between the two brackets indicates the number of samples.
3.9. The Phylogenetic Neighbor-joining Tree using RAPD Analysis
The result of five RAPD primers showed the relationship between the four species of Alestes collected from Kreima site. The relationships were illustrated by Neighbor-joining tree in PAUP program.
3.9.1. RAPD 1
RAPD 1 presents two main clusters. One cluster contained A. baremoze and A. dentex. The second cluster with A. nurse in one sub-cluster and A. macrolepidotus in the other.
3.9.2. RAPD2
The result showed that there is a relationship between A. baremoze and A. macrolepidotus and between A. macrolepidotus and A.dentex. A. nurse separated into one cluster.
3.9.3. RAPD3
The result obtained with RAPD3 reveals the relationship between A. nurse, A. baremoze, and A.dentex. One cluster contained A. macrolepidotus.
3.9.4. RAPD4
RAPD4 results depict four clusters each one composed of one species of Alestes (Fig. 10).
4. DISCUSSION
In this study the morphometric and meristic separated Alestes into two genera Alestes to include (A. baremoze and A. dentex) and Brycinus to include Brycinus (Alestes) nurse and Brycinus (Alestes) macrolepidotus. This confirmed what was proposed in the previous study [13]. Molecular analysis using OPX-17 (RAPD4) further confirmed this. It was suggested by Géry [24] to separate Alestidae as a family different from the Characidae. Considering Alestidae as a monophyletic group was proposed by Buckup [25] and later confirmed by Calcagnotto et al. [26]. The relationships among genera within the need to be resolved [27]. The present study used morphometric measurements, meristic counts and molecular-based techniques (RAPD-PCR) to characterize, and revises the systematic status for Alestes spp. in Kreima site based on samples collected from around Kreima (the Nile proper). The meristic findings in the present study were based on a large number of samples (24 from B. macrolepidotus, 100 from each of A. baremoze, A. dentex, and B. nurse) and yielded ranges higher than those reported by Bailey [13] whose work was based on [4]. The work of Boulenger was based on very small sample size (<10). Awad [28] studied seven morphometric characters of A. baremoze, A. dentex and A. nurse, and his data was not comparable with the present finding. His morphometric ratios were LD/BD, IOW/ED, PL/PD. Moreover, he neither studied meristic counts nor applied discriminant analysis.
Analysis of covariance was carried out using One way ANOVA test. It's used to test the variation in the measured morphological characters between all the populations studied. The test showed extremely highly statistically significant differences (p<0.000) between the four studied species (Tables 4). Ebraheem and Hamza [19, 29] used the same method and found highly statistically significant differences (p<0.005) between all the populations in Anopheles gambiae and Oreochromis spp, respectively.
Morphometric indices of traditional characters were used for identification of fish races and species by many investigators, including Khalil and Mekkawy [30]. PCA was carried out to simplify the analysis of the results. Correlation between the variables and component called loading. In this studied PCA showed two components with Eigenvalue more than 1 explaining the data with components percentage variance of 97.1% and 1.9%, respectively indicating a sharp decrease from component 1to component 27. PCA selected and ranked 11 characters as reliable descriptive of the four species. These included 3 meristic counts (LLS, SALL, and AFR) out of 7 and 8 morphometric measurements (BW, PVFL, HL, AFBL, PFL, LDFL, PPCL, and HW). Hamza [29] showed three-component contributed high Eigenvalue with a percentage variance of 71.3%, 13.8%, and 8.3%.
Box and whisker plots (Fig. 3) showed highly significant variations between the different Alestes species populations (p=0.000).
This multivariate data was subject to discriminant analysis to outline parameters that are truly important in sorting out the groups in Kreima site. The CDF showed extremely highly significant (p=0.000). Both methods were used by [19] to investigate Oreochromis niloticus, Sartherodon galilaeus, and Tilapia zilli. They yielded extremely highly significant (p=0.000) differences in the three study sites and highly significant (p= 0.003) differences from one site The CDF selected and ranked LLS, SALL, BW, PVFL, and HL characters as reliable descriptive in Function 1 in [19] study. In a study of three Epinepheline spp [31]. found that PRVFL/SL, DEVOFL/SL,DEDCFL/SL,VDOL/HL,VEAOFL/HL,AEVCFL/HL, and AEDCFL/HL out of 22 ratio indices are of discriminative value.
The dendrograms obtained during this study based on morphometrics measurements and meristic counts. All dendrogram separated A.nures and A.macrolepidotus in the same clade and A. baremoze and A. dentex in one clade.
In this, an mtDNA fragment of approximately 680 bp was amplified by PCR from all Alestes specimens when the primers 16S rRNA was used. However, a 502bp was obtained in this study. This is in agreement with [25] findings from four African characiform families. This may be due to the difference in location of the 16s rRNA gene in the Sudanese fish population studied compared to other population. Whether this region of the gene 16S rRNA gene can give an indication of the ancestral species needs further study.
According to Buckup [25], we need to verify characiform phylogeny. The taxonomy of the family Alestidae needs to be revised as suggested by Buckup [25].
The DNA RAPD analysis [9] proved to be useful in clarifying the phylogenetic relations with natural population, and in differentiating well-established species [32].
In this study, five DNA RAPD markers were used. (OPW-09) showed 14 bands ranging from 300 bp to 1200 bp and RAPD5 (OPX-19) showed 11 bands ranged from 300 bp to 950 bp. However, in a previous study on Astyanax altiparanae RAPD3 (OPW-09) yielded 8 bands ranged from 400 bp to 3000 bp and RAPD5 (OPX-19) yielded 6 bands ranged from 750 bp to 1700 bp [22]. The remaining primers RAPD1 (OPW-05), RAPD2 (OPW-08) and RAPD4 (OPX-17) yielded 10, 10, and 15 bands, respectively.
The result of Estimated Probability of Shannon analysis showed an unpredictable level of intra-specific variation. The low gene flow (0.002 to 0.076/generation) indicates that the four populations studied from Kreima site are not similar, and differentiate. However, previous studies in the Lguacu River (Brazil) on three studied Astyanax populations obtained a gene flow range from 2.4 to 4.0 [22].
According to Ebraheem [19], the Shannon diversity index was used to quantify levels of genetic diversity in isolated and inter and intra populations due to its relative non-sensitivity to bias. In the present study, Shannon weighted diversity for all population analyzed by RAPD1 to RAPD5 was ranged from 1.9-2.0 and stand-Divegrance ranged from 0.1-0.4. In a study of three populations of Astyanax altiparanae (Teleostei, Characidae) [22], the Shannon genetic diversity index was 0.58 (±0.15), 0.54 (±0.20), and 0.50 (±0.25).
The results of RAPD analysis using NJ tree showed more overlap between the population and there is no clear clustering in RAPD1, RAPD2, and RAPD3 analyses. However, RAPD4 and RAPD5 analyses illustrate the differences between Alestes population.
The results of this study illustrate the great convergence between morphometric and meristic study and virtual technology RAPD with clarity in the study of molecular genetics. RAPD analyses have shown more emphasis on the divergence of the population under study. This further demonstrates that the RAPD technique could be used in taxonomic studies.
Differences in the results of this study and the study of Priol et al. [22], which has used the same RAPD primers, were due to differences in species surveyed.
The RAPD polymorphism could be used as efficient tools for the detection of similarities and phylogenetic relationships of the studied genotypes, which could be useful in the breeding programs, such as assessing the level of genetic diversity and cultivar identity.
CONCLUSION
The study indicated the effectiveness of RAPD markers in detecting the ratio of polymorphism, monomorphism and estimating genetic distance among Alestes baremoze, Alestes dentex, Brycinus nurse, and Brycinus macrolepidotus from Kreima at the River Nile, Sudan.
ETHICS APPROVAL AND CONSENT TO PARTICIPATE
Not applicable.
HUMAN AND ANIMAL RIGHTS
Not applicable.
CONSENT FOR PUBLICATION
Not applicable.
AVAILABILITY OF DATA AND MATERIALS
Not applicable.
FUNDING
We would like to acknowledge the Sudanese Ministry of Higher Education and Scientific Research for funding the work.
CONFLICT OF INTEREST
The authors declares no conflict of interest, financial or otherwise.
ACKNOWLEDGEMENTS
None.


