All published articles of this journal are available on ScienceDirect.

Effects of Exercise and Bioprocessed Soybean Meal Diets during Rainbow Trout Rearing
Authors Info & Affiliations
Abstract
Background:
Alternative protein sources to fishmeal in fish feeds are needed.
Objectives:
Evaluate rearing performance of adult rainbow trout (Oncorhynchus mykiss) (initial weight 139.0 ±1.5 g, length 232.9 ± 0.8 mm, mean ± SE) fed one of the two isonitrogenous and isocaloric diets (46% protein, 16% lipid) and reared at one of the two levels of exercise (water velocities of either 3.6 cm/s or 33.2 cm/s).
Methods:
Protein in the control diet was based on fishmeal. In the experimental diet, bioprocessed soybean meal replaced approximately 60% of the fishmeal. Fish were fed by hand once-per-day to near satiation, and the food was increased daily. The experiment lasted 90-days.
Results:
There were no significant differences in gain, percent gain, or specific growth rate between the dietary treatments. However, the amount of food fed and feed conversion ratio was significantly lower in the 60% bioprocessed soybean meal diet. Intestinal morphology, relative fin length, splenosomatic index, hepatosomatic index, and viscerosomatic index were not significantly different in the trout fed either diet. Fish reared at 3.6 cm/s had a significantly lower feed conversion ratio (1.02 ± 0.02) than fish reared at 33.2 cm/s (1.13 ± 0.02). However, there were no significant differences in gain, percent gain, specific growth rate, or percentage mortality in fish reared with or without exercise. No significant interactions were observed between diet and exercise (higher water velocity).
Conclusion:
Based on these results, at least 60% of the fishmeal in adult rainbow trout diets can be replaced by bioprocessed soybean meal, even if higher water velocities are used to exercise the fish.
1. INTRODUCTION
The use of soybean (Glycine max) meal in carnivorous fish diets has been subjected to considerable research [1, 2]. However, the inclusion of soybean meal into salmonid diets, such as rainbow trout (Oncorhynchus mykiss), is limited because soybean meal contains numerous antinutritional factors [3-5] which can negatively impact fish health and growth [6-10]. Soybean meal can be treated with chemicals, pressure, or heat, to reduce or completely eliminate these antinutritional factors [11-13]. Bioprocessing, such as fermentation, is another method that can be used to improve the suitability of soybean meal in fish diets, and forms of bioprocessed soybean meal have been investigated as alternative protein sources in rainbow trout diets [14-16].
Just as dietary ingredients can impact fish growth, using higher water velocities to exercise fish can also positively impact rearing performance [17-20]. Parker and Barnes [20] observed improved growth in rainbow trout fed to satiation and exercised using elevated water velocities in circular tanks. However, growth has been shown to be impaired in exercised fish if the feed amounts were restricted [19].
A few studies evaluating forms of bioprocessed soybean meal (BSM) in rainbow trout diets have been conducted, but novel BSM products continue to be developed. In addition, very little research has been published examining the potential interaction between exercise (increased water velocities) and diet, particularly in relation to non-fishmeal based diets in any fish species. Therefore, the objective of this study was to evaluate the use of a propriety BSM product as the primary dietary protein source, in conjunction with exercise (increased water velocity), during rainbow trout rearing.
2. MATERIALS AND METHODS
This experiment was conducted at Cleghorn Springs State Fish Hatchery, Rapid City, South Dakota, USA. Rearing tanks received flow-through, single-pass, spring water (11° C, total hardness as CaCO3, 360 mg/L; alkalinity as CaCO3, 210 mg/L; pH, 7.6; total dissolved solids, 390 mg/L). The study began on July 7, 2016 and lasted 90 days.
Erwin x Arlee strain rainbow trout (initial weight 139.0 ± 1.5 g, length 232.9 ± 0.8 mm, mean ± SE) was randomly selected and placed into one of the 16, cement-bottom, aluminum-sided, circular tanks (6.1 m diameter, 73.7 cm water depth). Twenty fish were placed into each tank. This experiment used a 2 x 2 design (2 diets, 2 velocities; N = 4). Table 1 shows the study design, with water velocities and diets indicated.
| Treatment | N | Diet (% BSM) | Velocity (cm/s) | ||
|---|---|---|---|---|---|
| 1 | 2 | Low | High | ||
| (0) | (60) | (3.6 ± 0.6) | (33.2 ± 1.8) | ||
| 1 | 4 | X | X | ||
| 2 | 4 | X | X | ||
| 3 | 4 | X | X | ||
| 4 | 4 | X | X | ||
Tank water flows and velocities were constant throughout the experiment, and were measured and maintained using a flowmeter (Flowatch, JDC Electronic SA, Yverdon-les-Bains, Jura-Nord Vaudois, Vaud, Switzerland). Velocity measurements were obtained directly behind the spray bar, 60.0 cm from the side of the tank and mid-depth (36.1 cm from the surface).
The two diets used in this study contained either fishmeal with no BSM, or had BSM replace approximately 60% of the dietary fishmeal (Table 2). A proprietary microbial conversion was used to produce the BSM (South Dakota State University, Brookings, South Dakota, USA). Feeds were prepared using an extruder (ExtruTech model 325, Sabetha, Kansas, USA), and were isocaloric and isonitrogenous. AOAC [21] method 2001.11 analysis was used to determine dietary protein, method 2003.5 (modified by substituting petroleum ether for diethyl ether) was used to determine crude lipid, and AACC [22] method 08-03 was used to determine ash content.
| – | Diet (%) | |
|---|---|---|
| Ingredients | 1 | 2 |
| Fishmeala | 35.0 | 14.0 |
| Bioprocessed soybean mealb | 0.0 | 21.0 |
| Wheat middsc | 12.0 | 10.0 |
| Whole wheatc | 17.7 | 15.2 |
| Poultry byproduct meald | 10.0 | 15.0 |
| Blood meale | 2.0 | 2.0 |
| Feather meald | 7.0 | 2.5 |
| Vitamin premixf | 1.3 | 1.3 |
| Mineral premixf | 0.8 | 2.0 |
| Micro-mineral premixf | 0.8 | 0.8 |
| Choline chlorideg | 0.6 | 0.6 |
| L-Lysineh | 1.5 | 2.0 |
| L-Methioninei | 0.3 | 0.5 |
| Stay-C 35j | 0.2 | 0.2 |
| Fish oilk | 11.0 | 13.0 |
| Total | 100 | 100 |
| Chemical analysis (% dry basis) | – | – |
| Protein | 43.18 | 43.85 |
| Lipid | 15.91 | 14.28 |
| Ash | 2.42 | 3.60 |
| Nitrogen-free extract | 20.48 | 24.33 |
| Dry matter | 93.00 | 95.20 |
| Gross Energy (kJ/g) | 16.5 | 16.0 |
| Protein : Energy (MJ/g) | 26.2 | 27.4 |
Each fish was individually weighed to the nearest 0.1 g and measured to the nearest 1.0 mm prior to placement into one of the sixteen tanks at the beginning of the experiment. At approximately four week intervals, each individual fish was again weighed and measured. Total tank weight was calculated by adding all of the individual fish weights for each tank. Fish were not fed on the days that they were sampled. The hatchery constant method [23] was used to determine initial feeding amounts, using 1.1 as the anticipated feed conversion ratio and 0.08 cm/day as the projected growth rate, based on the historical maximum growth rate for this strain of rainbow trout at Cleghorn Hatchery. The feed was dispersed by hand once per day, with amounts adjusted daily to ensure feed levels were at or near satiation. Mortality and the food fed amounts were recorded daily.
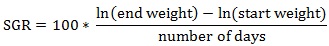
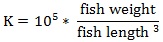
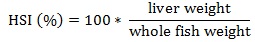
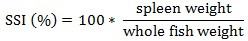
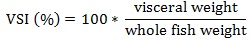
Prior to data collection on days 1, 31, and 61, the fish were anesthetized using 60 mg/L MS-222 (Tricaine-S, tricaine methanesulfonate, Syndel USA, Ferndale, Washington, USA). At the end of the study, the fish were euthanized using a lethal dose of 250 mg/L MS-222 [24]. On the last day of the experiment, individual weights and lengths were recorded from all of the fish in each tank. In addition, fin lengths (to the nearest 1.0 mm) and spleen, liver, and visceral weights (to the nearest 1.0 mg) were also recorded from five randomly selected trout per tank. Fin indices, Specific Growth Rate (SGR), Condition Factor (K), Hepatosomatic Index (HSI) [25], Splenosomatic Index (SSI) [26], and Viscerosomatic Index (VSI) [26] were calculated.
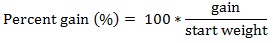
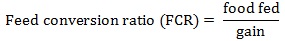
The equations used in this study included:
 |
 |
 |
 |
 |
 |
 |
 |
 |
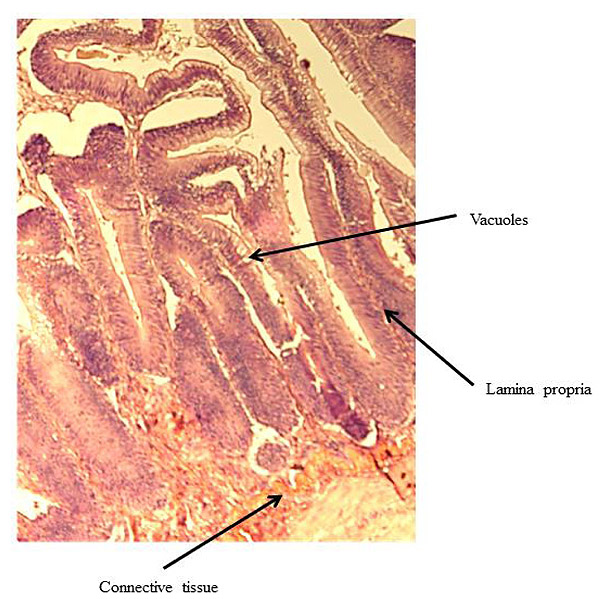
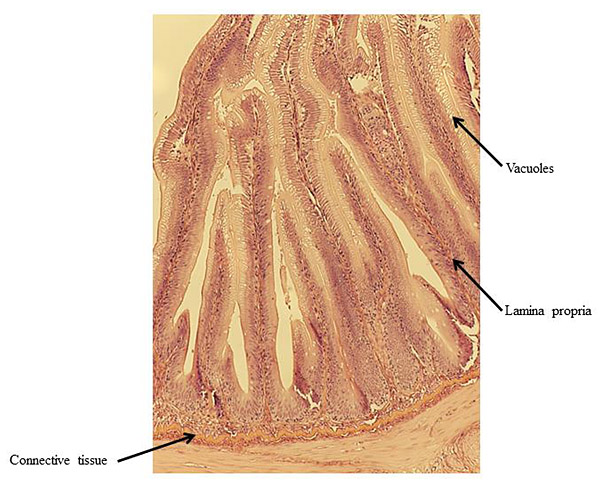
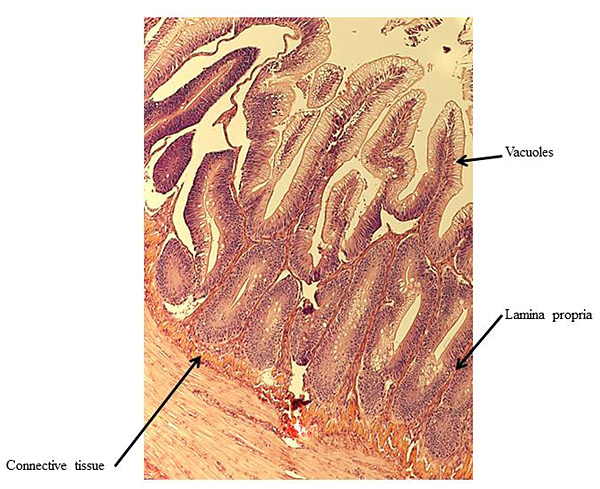
At the end of the experiment, possible soy-induced enteritis was assessed by excising a 2-mm wide section of the distal intestine from five randomly-selected fish per tank. After excision, the intestinal tissue was immediately fixed using 10% buffered formalin, and then stained with hematoxylin and eosin [27, 28]. An ordinal system was then used to score the stained intestinal cross-sections, based on lamina propria thickness and cellularity, submucosal connective tissue width, and leukocyte distribution [29-31] (Table 3).
For data analysis, two-way Analysis Of Variance (ANOVA) was performed using the SPSS (9.0) statistical analysis program (SPSS, Chicago, Illinois, USA) was used. If the treatments were significantly different, then Tukey’s HSD post hoc mean separation test was performed. Significance was predetermined at P < 0.05.
This experiment was carried out within the American Fisheries Society “Guidelines for the Use of Fishes in Research” [32] and within the guidelines of the Aquatics Section Research Ethics Committee of the South Dakota Department of Game, Fish and Parks, USA.
| Score | Appearance |
|---|---|
| – | Lamina Propria of Simple Folds |
| 1 | Thin and delicate core of connective tissue in all simple folds. |
| 2 | Lamina propria slightly more distinct and robust in some of the folds. |
| 3 | Clear increase in lamina propria in most of simple folds. |
| 4 | Thick lamina propria in many folds. |
| 5 | Very thick lamina propria in many folds. |
| – | Connective Tissue between Base of Folds and Stratum Compactum |
| 1 | Very thin layer of connective tissue between base of folds and stratum compactum. |
| 2 | Slightly increased amount of connective tissue beneath some of mucosal folds. |
| 3 | Clear increase of connective tissue beneath most of the mucosal folds. |
| 4 | Thick layer of connective tissue beneath many folds. |
| 5 | Extremely thick layer of connective tissue beneath some of the folds. |
| – | Vacuoles |
| 1 | Large vacuoles absent. |
| 2 | Very few large vacuoles present. |
| 3 | Increased number of large vacuoles. |
| 4 | Large vacuoles are numerous. |
| 5 | Large vacuoles are abundant and present in most epithelial cells. |
3. RESULTS
There were no significant differences in gain, percent gain, SGR, and percent mortality between the tanks of fish receiving the fishmeal reference diet or the 60% BSM diet at the end of the experiment (Table 4). However, food fed and FCR were significantly different between the diets, with the fishmeal reference diet having higher values for both variables. The mean (± SE) FCR for rainbow trout fed the fishmeal diet was 1.10 (± 0.02), which was significantly higher than the 1.04 (± 0.03) value for fish fed 60% BSM.
| – | – | Diet (% BSM) | – | |
|---|---|---|---|---|
| Velocity | 1 (0) | 2 (60) | Overall | |
| Initial | ||||
| Start weight (g) | Low | 2,843.0 ± 91.0 | 2,769.0 ± 18.4 | 2,806.0 ± 45.2 |
| High | 2,734.8 ± 48.9 | 2,771.2 ± 74.5 | 2,753.0 ± 41.8 | |
| Overall | 2,788.9 ± 52.0 | 2,770.1 ± 35.5 | – | |
| Days 1-31 | ||||
| End weight (g) | Low | 4,637.4 ± 136.5 | 4,442.6 ± 88.3 | 4,540.0 ± 83.8 |
| High | 4,294.6 ± 72.4 | 4,375.8 ± 164.7 | 4,335.2 ± 84.7 | |
| Overall | 4,466.0 ± 96.5 | 4,409.2 ± 87.4 | – | |
| Gain (g) | Low | 1,794.3 ± 55.7 | 1,673.6 ± 90.5 | 1,733.9 ± 54.2 |
| High | 1,559.8 ± 39.4 | 1,604.6 ± 96.4 | 1,582.2 ± 48.9 | |
| Overall | 1,677.0 ± 54.4 | 1,639.1 ± 62.6 | – | |
| Gain (%) | Low | 63.2 ± 1.5 | 60.5 ± 3.4 | 61.8 ± 1.8 |
| High | 57.1 ± 1.5 | 57.8 ± 2.2 | 57.4 ± 1.2 | |
| Overall | 60.1 ± 1.5 | 59.1 ± 1.9 | – | |
| Food fed (g) | Low | 1,796 ± 39 | 1,534 ± 46 | 1,665 ± 57 |
| High | 1,792 ± 11 | 1,613.0 ± 53 | 1,703 ± 42 | |
| Overall | 1,794 ± 19 z | 1,574 ± 36 y | – | |
| FCR | Low | 1.00 ± 0.03 | 0.92 ± 0.03 | 0.96 ± 0.02 y |
| High | 1.15 ± 0.01 | 1.01 ± 0.05 | 1.08 ± 0.04 z | |
| Overall | 1.08 ± 0.03 z | 0.97 ± 0.03 y | – | |
| SGR | Low | 1.63 ± 0.03 | 1.57 ± 0.07 | 1.60 ± 0.04 |
| High | 1.51 ± 0.03 | 1.52 ± 0.05 | 1.51 ± 0.03 | |
| Overall | 1.57 ± 0.03 | 1.55 ± 0.04 | – | |
| Days 32-61 | ||||
| End weight (g) | Low | 7,365.6 ± 337.6 | 6,978.8 ± 200.3 | 7,172.2 ± 195.9 |
| High | 6,862.8 ± 60.3 | 6,917.4 ± 293.3 | 6,890.1 ± 139.0 | |
| Overall | 7,114.2 ± 185.0 | 6,948.1 ± 164.8 | – | |
| Gain (g) | Low | 2,728.2 ± 229.5 | 2,536.3 ± 115.5 | 2,632.2 ± 124.3 |
| High | 2,568.2 ± 90.3 | 2,541.6 ± 144.1 | 2,554.9 ± 78.9 | |
| Overall | 2,648.2 ± 118.1 | 2,539.0 ± 85.5 | – | |
| Gain (%) | Low | 58.7 ± 3.9 | 57.0 ± 1.6 | 57.8 ± 2.0 |
| High | 59.9 ± 2.9 | 58.0 ± 2.0 | 59.0 ± 1.7 | |
| Overall | 59.3 ± 2.3 | 57.5 ± 1.2 | 58.4 ± 1.3 | |
| Food fed (g) | Low | 2,757 ± 204 | 2,318 ± 118 | 2,537 ± 137 |
| High | 2,778 ± 110 | 2,438 ± 96 | 2,608 ± 93 | |
| Overall | 2,767 ± 107 z | 2,378 ± 74 y | – | |
| FCR | Low | 1.01 ± 0.03 | 0.91 ± 0.02 | 0.96 ± 0.02 y |
| High | 1.08 ± 0.01 | 0.96 ± 0.03 | 1.02 ± 0.03 z | |
| Overall | 1.05 ± 0.02 z | 0.94 ± 0.02 y | – | |
| SGR | Low | 1.54 ± 0.08 | 1.50 ± 0.03 | 1.52 ± 0.04 |
| High | 1.56 ± 0.06 | 1.52 ± 0.04 | 1.54 ± 0.04 | |
| Overall | 1.55 ± 0.05 | 1.5 ± 0.02 | – | |
| Days 62-90 | ||||
| End weight (g) | Low | 10,791.1 ± 449.7 | 10,132.3 ± 338.2 | 10,461.7 ± 288.7 |
| High | 9,842.9 ± 208.2 | 9,673.1 ± 281.8 | 9,758.0 ± 165.3 | |
| Overall | 10,317.0 ± 291.1 | 9,902.7 ± 221.5 | – | |
| Gain (g) | Low | 3,425.5 ± 121.3 | 3,153.5 ± 147.4 | 3,289.5 ± 102.2 z |
| High | 2,980.1 ± 184.4 | 2,755.6 ± 56.9 | 2,867.9 ± 98.9 y | |
| Overall | 3,202.8 ± 132.4 | 2,954.6 ± 104.9 | – | |
| Gain (%) | Low | 46.6 ± 0.9 | 45.1 ± 1.1 | 45.9 ± 0.7 y |
| High | 43.4 ± 2.6 | 40.1 ± 2.0 | 41.7 ± 1.6 z | |
| Overall | 45.0 ± 1.4 | 42.6 ± 1.4 | – | |
| Food fed (g) | Low | 3,780 ± 210 | 3,390 ± 126 | 3,585 ± 135 |
| High | 3,653 ± 131 | 3,547 ± 70 | 3,600 ± 72 | |
| Overall | 3,716 ± 117 | 3,468 ± 73 | – | |
| FCR | Low | 1.10 ± 0.03 | 1.08 ± 0.03 | 1.09 ± 0.02 y |
| High | 1.23 ± 0.05 | 1.29 ± 0.05 | 1.26 ± 0.03 z | |
| Overall | 1.17 ± 0.04 | 1.18 ± 0.05 | – | |
| SGR | Low | 1.28 ± 0.02 | 1.24 ± 0.02 | 1.26 ± 0.02 z |
| High | 1.20 ± 0.06 | 1.12 ± 0.05 | 1.16 ± 0.04 y | |
| Overall | 1.24 ± 0.03 | 1.18 ± 0.03 | – | |
| Overall (Days 1-90) | ||||
| Gain (g) | Low | 7,948.0 ± 392.2 | 7,363.3 ± 341.3 | 7,655.7 ± 264.8 |
| High | 7,108.1 ± 234.6 | 6,901.9 ± 215.7 | 7,005.0 ± 152.6 | |
| Overall | 7,528.1 ± 264.5 | 7,132.6 ± 206.2 | – | |
| Gain (%) | Low | 279.6 ± 11.2 | 266.0 ± 12.8 | 272.8 ± 8.3 |
| High | 260.4 ± 11.7 | 249.1 ± 4.0 | 254.8 ± 6.1 | |
| Overall | 270.0 ± 8.3 | 257.5 ± 7.0 | – | |
| Food fed (g) | Low | 8,333 ± 443 | 7,241 ± 288 | 7,787 ± 320 |
| High | 8,224 ± 239 | 7,599 ± 217 | 7,911 ± 190 | |
| Overall | 8,278 ± 234 z | 7,420 ± 180 y | – | |
| FCR | Low | 1.05 ± 0.01 | 0.98 ± 0.02 | 1.02 ± 0.02 y |
| High | 1.12 ± 0.01 | 1.10 ± 0.02 | 1.13 ± 0.02 z | |
| Overall | 1.10 ± 0.02 z | 1.04 ± 0.03 y | – | |
| SGR | Low | 1.48 ± 0.03 | 1.44 ± 0.04 | 1.46 ± 0.02 |
| High | 1.42 ± 0.04 | 1.39 ± 0.01 | 1.41 ± 0.02 | |
| Overall | 1.45 ± 0.02 | 1.41 ± 0.02 | – | |
| Mortality (%) | Low | 2.5 ± 2.5 | 0.0 ± 0.0 | 1.2 ± 1.2 |
| High | 1.2 ± 1.2 | 0.0 ± 0.0 | 0.6 ± 0.6 | |
| Overall | 1.9 ± 1.3 | 0.0 ± 0.0 | – | |
Similar to the overall end-of-experiment results, there was no significant difference in gain, percent gain, or SGR in any of the rearing periods between the fish being fed the two different diets. The amount of food fed and FCR were significantly different between the diets in the first two rearing periods and overall, but were not significantly different in the final rearing period.
There were no significant differences in individual fish weight, length, and condition factor between dietary treatments at the end of the experiment (Table 5). There were also no significant differences in fin indices (pelvic, pectoral, dorsal), organosomatic indices (SSI, HSI, VSI), or intestinal histological scores. A representative image of the distal intestines from fish in each treatment group are shown in Figs. (1-4).
The velocity results indicated that the trout in the high velocity tanks had a significantly greater FCR than the fish in the lower velocity tanks in each rearing period and overall. Gain, percent gain, food fed, SGR, and percent mortality were not significantly different between the two velocity treatments at the end of the experiment. However, during the third (final) rearing period gain, percent gain, and SGR were significantly greater in the low velocity treatment, with a mean (± SE) percent gain of 45.9 (± 0.7) %, compared to 41.7 (± 1.6) % for fish in the higher velocity tanks.
Individual fish weight and length were significantly greater at the end of the experiment for fish reared at the low velocity, with the mean (± SE) weights of 527.2 (± 15.2) g and 485.1 (± 9.6) g for the fish at low and high velocities, respectively. There were no significant differences in final fin indices (pectoral, pelvic, dorsal), organosomatic indices (HSI, SSI, VSI), or gut histology scores between the velocity treatments. There were also no significant interactions between diet and velocity in any of the variables measured at the end of the study or during any of the rearing periods.
| – | – | Diet (% BSM) | – | ||
|---|---|---|---|---|---|
| Velocity | 1 (0) | 2 (60) | Overall | ||
| Initial | |||||
| Weight (g) | Low | 142.2 ± 4.6 | 138.4 ± 0.9 | 140.3 ± 2.3 | |
| High | 136.8 ± 2.4 | 138.6 ± 3.7 | 137.6 ± 2.1 | ||
| Overall | 139.4 ± 2.6 | 138.5 ± 1.8 | – | ||
| Length (mm) | Low | 233.2 ± 2.9 | 232.9 ± 1.0 | 233.1 ± 1.4 | |
| High | 233.4 ± 1.8 | 231.8 ± 1.8 | 232.6 ± 1.2 | ||
| Overall | 233.3 ± 1.6 | 232.4 ± 1.0 | – | ||
| K | Low | 1.13 ± 0.03 | 1.08 ± 0.01 | 1.11 ± 0.02 | |
| High | 1.06 ± 0.01 | 1.10 ± 0.01 | 1.08 ± 0.01 | ||
| Overall | 1.10 ± 0.02 | 1.09 ± 0.01 | – | ||
| Days 1-31 | |||||
| End weight (g) | Low | 231.8 ± 6.8 | 222.1 ± 4.4 | 227.0 ± 4.2 | |
| High | 212.0 ± 1.0 | 218.8 ± 8.2 | 215.4 ± 4.0 | ||
| Overall | 221.9 ± 4.9 | 220.5 ± 4.4 | – | ||
| End length (mm) | Low | 262.0 ± 3.2 | 260.6 ± 1.0 | 261.3 ± 1.6 | |
| High | 256.8 ± 0.9 | 256.8 ± 3.3 | 256.8 ± .16 | ||
| Overall | 259.4 ± 1.8 | 258.7 ± 1.7 | – | ||
| K | Low | 1.27 ± 0.01 | 1.24 ± 0.02 | 1.25 ± 0.01 | |
| High | 1.24 ± 0.01 | 1.27 ± 0.01 | 1.26 ± 0.01 | ||
| Overall | 1.25 ± 0.01 | 1.26 ± 0.01 | – | ||
| Days 32-61 | |||||
| End weight (g) | Low | 371.9 ± 16.6 | 349.0 ± 10.0 | 360.4 ± 10.0 | |
| High | 339.0 ± 4.6 | 345.9 ± 14.7 | 342.4 ± 7.2 | ||
| Overall | 355.4 ± 10.1 | 347.4 ± 8.2 | – | ||
| End length (mm) | Low | 299.6 ± 4.2 | 295.4 ± 0.8 | 297.5 ± 2.1 | |
| High | 292.3 ± 1.1 | 291.0 ± 3.0 | 291.6 ± 1.5 | ||
| Overall | 295.9 ± 2.4 | 293.2 ± 1.7 | – | ||
| K | Low | 1.36 ± 0.01 | 1.34 ± 0.04 | 1.35 ± 0.02 | |
| High | 1.34 ± 0.02 | 1.39 ± 0.03 | 1.36 ± 0.02 | ||
| Overall | 1.35 ± 0.01 | 1.36 ± 0.03 | – | ||
| Days 62-90 (Final) | |||||
| End weight (g) | Low | 547.9 ± 22.7 | 506.6 ± 16.9 | 527.2 ± 15.2 z | |
| High | 486.6 ± 15.1 | 483.6 ± 14.1 | 485.1 ± 9.6 y | ||
| Overall | 517.2 ± 17.1 | 495.1 ± 11.1 | – | ||
| End length (mm) | Low | 336.2 ± 4.9 | 331.9 ± 2.7 | 334.1 ± 2.7 z | |
| High | 326.8 ± 2.6 | 324.0 ± 3.8 | 325.4 ± 2.2 y | ||
| Overall | 331.5 ± 3.1 | 328.0 ± 2.6 | – | ||
| K | Low | 1.41 ± 0.01 | 1.36 ± 0.02 | 1.39 ± 0.01 | |
| High | 1.38 ± 0.01 | 1.41 ± 0.02 | 1.39 ± 0.01 | ||
| Overall | 1.40 ± 0.01 | 1.38 ± 0.01 | – | ||
| Pectoral index (%) | Low | 11.74 ± 0.18 | 12.13 ± 0.19 | 11.94 ± 0.14 | |
| High | 11.92 ± 0.20 | 11.81 ± 0.09 | 11.87 ± 0.10 | ||
| Overall | 11.83 ± 0.13 | 11.97 ± 0.12 | – | ||
| Pelvic index (%) | Low | 10.13 ± 0.09 | 10.32 ± 0.25 | 10.22 ± 0.13 | |
| High | 10.42 ± 0.14 | 10.52 ± 0.04 | 10.49 ± 0.07 | ||
| Overall | 10.27 ± 0.09 | 10.42 ± 0.12 | – | ||
| – | – | Diet (% BSM) | – | ||
|---|---|---|---|---|---|
| Velocity | 1 (0) | 2 (60) | Overall | ||
| Dorsal index (%) | Low | 7.43 ± 0.85 | 6.55 ± 0.25 | 6.99 ± 0.44 | |
| High | 5.74 ± 0.69 | 6.86 ± 0.65 | 6.30 ± 0.49 | ||
| Overall | 6.59 ± 0.60 | 6.71 ± 0.33 | – | ||
| HSI (%) | Low | 1.58 ± 0.05 | 1.50 ± 0.04 | 1.54 ± 0.03 | |
| High | 1.38 ± 0.12 | 1.45 ± 0.02 | 1.41 ± 0.06 | ||
| Overall | 1.48 ± 0.07 | 1.48 ± 0.02 | – | ||
| SSI (%) | Low | 0.078 ± 0.009 | 0.083 ± 0.006 | 0.080 ± 0.005 | |
| High | 0.083 ± 0.008 | 0.078 ± 0.005 | 0.080 ± 0.004 | ||
| Overall | 0.080 ± 0.005 | 0.080 ± 0.004 | – | ||
| VSI (%) | Low | 13.90 ± 0.56 | 12.89 ± 0.19 | 13.39 ± 0.33 | |
| High | 13.14 ± 0.62 | 13.2 ± 0.40 | 13.18 ± 0.34 | ||
| Overall | 13.52 ± 0.41 | 13.05 ± 0.21 | – | ||
| Lamina propria | Low | 1.40 ± 0.28 | 1.43 ± 0.21 | 1.42 ± 0.16 | |
| High | 1.56 ± 0.26 | 1.60 ± 0.37 | 1.58 ± 0.21 | ||
| Overall | 1.48 ± 0.18 | 1.52 ± 0.20 | – | ||
| Connective Tissue | Low | 2.10 ± 0.40 | 2.37 ± 0.28 | 2.23 ± 0.23 | |
| High | 1.93 ± 0.22 | 1.92 ± 0.34 | 1.93 ± 0.19 | ||
| Overall | 2.02 ± 0.22 | 2.14 ± 0.22 | – | ||
| Vacuoles | Low | 1.95 ± 0.05 | 1.73 ± 0.09 | 1.84 ± 0.06 | |
| High | 1.76 ± 0.31 | 1.85 ± 0.34 | 1.81 ± 0.21 | ||
| Overall | 1.86 ± 0.15 | 1.79 ± 0.17 | – | ||

4. DISCUSSION
The results of this experiment indicate that BSM can directly replace at least 60% of the dietary fishmeal in adult rainbow trout diets, even for fish subjected to exercise with higher velocities. Similar results have also been reported for non-exercised rainbow trout fed diets with different forms of BSM than that used in this study [14, 33-36]. Yamamoto et al. [15, 16] were able to successfully replace all the fishmeal with fermented soybean meal in rainbow trout diets. However, these studies were conducted in much warmer water (16.3 °C), and the diets were supplemented with numerous amino acids. Voorhees et al. [37] used the same BSM product as the current study and noted that replacing up to 85% of dietary fishmeal was possible without compromising juvenile rainbow trout rearing performance. BSM as a dietary protein source has been evaluated in at least 14 other fish species, including other salmonids [38-55].
The duration of this study should have been long enough to provide valid and reliable results. Weathercup and McCraken [56] noted that feed trials should last long enough to determine any dietary-induced differences in fish growth and rearing performance. The National Research Council [57] recommends minimum study duration of 56-84 days, or longer if needed for large fish to attain 200-300% gain. The 265% gain at the end of this 90-day study met these requirements.
Undesirable effects on the distal intestine of rainbow trout from dietary soybean products are well-documented [4, 8-10]. However, the rainbow trout receiving BSM diet did not show any significant intestinal changes or enteritis. The proprietary process of manufacturing the BSM in this study likely depleted the saponins and other compounds linked to enteritis [7, 16, 33, 58].
HSI values are an indicator of the nutritional state of a fish because they indirectly measure glycogen and carbohydrate levels [59-61]. The similar HSI values in all of the treatments indicate energy partitioning is likely similar among the fish. At approximately 1.5, the HSI values observed in this study were similar to those previously reported in several studies [19, 20, 29, 34, 58, 62], but slightly higher than those reported in four other experiments [15, 16, 34, 36]. These differences could be due to differences in the ages and sizes of the fish examined [59] and the rainbow trout used in this study were much larger and older than the fish typically used in nutrition experiments.
VSI reflects the use and storage of lipids, and VSI and lipid levels are positively related [63-65]. It is likely that the equivalent dietary lipid levels are reflected in the similar VSI values observed in this study. The VSI values of approximately 13.3 in this study are similar to one other study examining adult rainbow trout [29], but are higher compared to other studies using smaller and younger rainbow trout [19, 20, 34-36, 58, 62].
SSI is an indication of hematopoietic capacity [59], as well as antibody production [66]. The lack of difference in SSI values likely indicates that neither diet contributed to any changes in fish health during the study. The SSI values observed in this study were within the range reported by several others [20, 35, 36, 57].
In addition to diet, increasing water velocities and forcing fish to exercise can also dramatically affect fish rearing performance [17-20]. Other studies noted the positive effects of exercise on fish growth have lasted 29 to 70 days, which is a much shorter duration than this study [67-69]. Only one experiment lasted four months, but it did not report rearing performance [70]. In the current study, exercise improved fish growth, but only for the first two months. What happened after two months of exercise? It is possible the fish became fatigued. Exercise fatigue has also been reported in humans after prolonged and intense exercise periods [71-74]. Just as was observed in this study with rainbow trout, Voorhees et al. [44] performed a similar experiment using brown trout and found that exercise improved rearing performance, but for only the first two months.
The higher (poorer) FCR in the exercised fish may have been because the fish were underfed. Parker and Barnes [20] reported that exercised rainbow trout fed to satiation had similar FCRs to unexercised trout, but if exercised fish were fed a restricted diet, FCR increased. Although food availability was increased daily in accordance with apparent satiation in this study, it may have been insufficient to compensate for the extra energy demands of exercise at higher velocities.
The relative fin lengths observed in this study were similar between the dietary treatments, indirectly indicating that dietary bioprocessed soybean meal is suitable as a fish meal replacement. It should be noted that relative fish lengths, although influenced by nutrition [75, 76], can also be impacted by numerous other factors [75-84]. In addition, the relative fin lengths in this experiment are similar to those reported previously [78, 85].
CONCLUSION
BSM can replace at least 60% of the dietary fishmeal in adult rainbow trout diets with no adverse effects, even if the trout are exercised. However, regardless of diet, fatigue may be occurring in fish subjected to a long period of exercise in continuously-elevated water velocities.
ETHICS APPROVAL AND CONSENT TO PARTICIPATE
The study is approved by Aquatics Section Research Ethics Committee of the South Dakota Department of Game, Fish and Parks, USA.
HUMAN AND ANIMAL RIGHTS
No humans were used for the study. All the reported experiments on animals were in accordance with the American Fisheries Society “Guidelines for the Use of Fishes in Research”.
CONSENT FOR PUBLICATION
Not applicable.
CONFLICT OF INTEREST
The authors declare no conflict of interest, financial or otherwise.
ACKNOWLEDGEMENTS
We thank Cody Treft, Tabor Martin, and Brian Fletcher for assisting in this experiment. Alex Rosburg provided comments on an earlier draft that improved the manuscript. The South Dakota Cooperative Fish and Wildlife Research Unit is jointly sponsored by the U.S. Geological Survey, South Dakota Department of Game, Fish and Parks, South Dakota State University, the Wildlife Management Institute, and the U.S. Fish and Wildlife Service. Any use of trade names is for descriptive purposes only and does not imply endorsement by the U.S. Government.